Introduction - Software Engineering
- Definition
- SE is a Systematic, Disciplined, Cost-effective techniques for software development
- Engineering approach to develop a software
- Evolution
- 1945 - 1965
- 1965 - 1985
- Crisis
- 98% of the software developed were scrapped or never used
- 1990 - 2000
- 2000 - 2010
- 2010 - Now
- Requirement Analysis
- Software Project Management
- Risk Management
- Risk is an uncertain event or condition that has a positive or negative effect on project's objective
- Systematic attempt to specify threats to the project plan (Estimates, Schedule, Resource)
- The project manager takes step toward avoiding them when possible and controlling them when necessary
- Risk Management plan is a document that project manager prepares
- Strategies
- Reactive
- Tries to reduce the damage of potential threats, but assume that those threats will happen eventually
- Proactive
- Identifies threats and aim to prevent those events from ever happening
- Types
- Business Risk
- Technical Risk
- Quality, Design, Interference, Interface, Maintenance
- Project Risk
- Schedule, Cost, Resources, Customer related
- Ways to Handle
- Risk Assessment
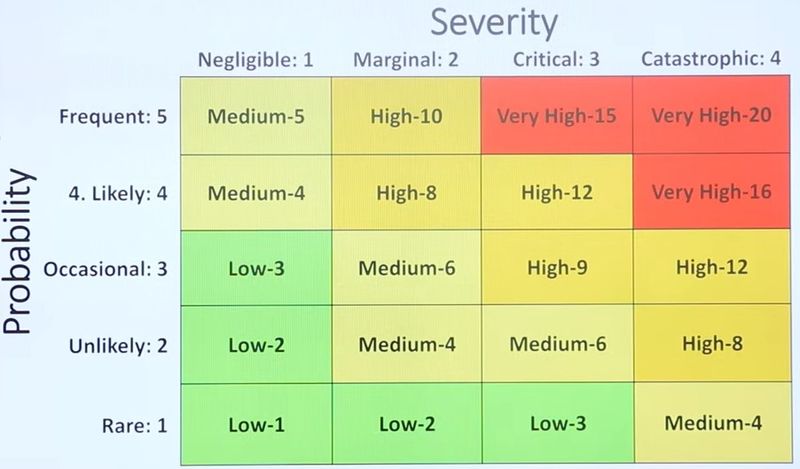
- Process to rank the risk in terms of their damage
- Determine the average probability of occurrence value for each risk
- Determine the impact for each component based on impact assessment matrix (Severity Value)
- Identify, Analyze, Prioritize
- RA = Probability * Severity
- Risk Control
- Specific actions to reduce a risk's event probability of happening
- Monitor, Avoid, Transfer
- Risk Mitigation
- Set of actions to reduce the impact of risk event
- Control Strategies
- Risk Avoidance
- Risk Transfer
- Risk Reduction
- Risk Monitoring
- Software Design
- Data Flow Diagram (DFD)/Bubble Chart
- Basic
- Graphical tool, Useful for communicating with users, managers and others
- Useful for analyzing existing as well as proposed systems
- Focus on the movement of data between external entities and processes, and between processes and data stores
- A relatively simple technique to learn and use
- DFD ELements
- Source/Sinks (External entities)
- Source -=> Supplies data to the system
- Sink -=> Receives data from the system
- Represented by Rectangle
- They do not process data
- Data Flows
- Basic
- Marks movement of data through the system, A pipeline to carry data
- Connects all other 3
- Generally unidirectional
- Represented by Arrows
- Labels are assigned to Data flow
- Rules
- Data can flow from
- External entity to Process
- Process to External entity
- Process to Store and back
- Process to Process
- Data can't flow from
- External entity to External entity
- External entity to Store
- Store to External entity
- Store to Store
- Processes
- Represented by Circle
- Incoming Arrow -=> Input data flows
- Outgoing Arrow -=> Output data flows
- Data Stores
- Repository of data
- Represented by 2 Parallel lines
- Incoming Arrow -=> Data can be written
- Outgoing Arrow -=> Data can be read
- External entities can't read or write
- Decomposition of DFD
- A System is too complex to be shown on a single DFD
- Decomposition is the iterative process of exploding data flow diagrams to create more detail
- Level 0 data flow diagrams may be exploded into successive low levels of detail
- The next level of detail would be a level 1 data flow diagram
- The DFDs become linked together in a hierarchy, which would fully document the system
- Levels of DFD
- Logical & Physical DFD
- Coding and Testing
- Maintenance
- Quality Management
- Reuse